Only include tables and figures in your essay if the information cannot be communicated in the text of your paper. Tables are generally used to show numerical or textual information while figures tend to be more graphical representations such as a chart, graph, photograph, or drawing. For ease of explanation, only the word “table” will be used below, but the same applies to figures; if figures differ then it will clearly be indicated.
The follow elements are required for tables and figures in APA Style:
Table Numbers:
Each table that you place in your paper is numbered consecutively (Table 1., Table 2., etc).
- Number your tables in the order they are first mentioned in your text beginning with Table 1.
- Table numbers should be in bold and flush to the left margin, at the top of the table, (one double-spaced line above the table title).
Table Titles:
Each table that you place in your paper has a title. Titles for tables should be brief, clear, and explanatory.
- The titles of table are italicized, left aligned, and in title case, e.g. Reasons Why Individuals Like Wine.
Table Notes:
Each table that you place in your paper should include a note afterwards to further explain the supplement or clarify information in the table or figure to your paper and can be general, specific, and probability.
- Begin the table note one double-spaced line after the table.
- Begin with the label “Note.” in italicized text. Include the period after the word “Note.”
- Type the necessary information in your note in regular, non-italicized font.
- For tables that you have obtained from secondary sources, include if they have been adapted, reprinted, modified, or have a copyright attribution. A copyright attribution is used instead of an in-text citation.
Some Common Table Formatting Tips:
Call Out: In your paper, refer to every table that you have inserted. Do not include a table in your work that you do not clearly explain in relation to the ideas in your paper.
- Do not write "the table above" or "the table below" or "the table on page 4." Instead refer to the table number and use this as an opportunity to tell your reader what to look for, e.g. "as shown in Table 1 there is a clear correlation ..." or "... of the results of the testing (see Table 1)."
- In general, only refer to the table number and not the title.
Reprinting or Adapting:
If you did not create the table yourself, for instance if you found it on the internet, you must include a copyright attribution in a note below the table.
- A copyright attribution is used instead of an in-text citation.
- Each work should also be listed in the reference list.
Please see pages 390-391 in the Manual for example copyright attributions.
Placement:
Tables may be placed either within the text of your paper or all together at the end of your document after the reference list. In either location, tables should be aligned to the left margin, (not center aligned).
- When embedding in the text, position them after a paragraph break, preferably the paragraph in which they are referred to, with a double-spaced blank line between the table and the text.
- If you are choosing to include tables after your reference, then list place each one on a separate page.
- Tables can also appear at the end of a paper in the form of an appendix.
Table Formatting:
- Ensure each column in your table has a heading. Capitalize only the first letter of the first word of all headings. Headings should not be much wider than the widest entry.
- In general, you would include solid horizontal lines in your table above and below the headings and after the last row. Do not include vertical lines between the columns or boxes around individual cells.
Figure Formatting:
- Use a simple sans serif font, such as Arial or Calibri, with font size no smaller than 8 points and no larger than 14 points.
- Axis labels on graphs should be parallel to their axes in title case.
- You may use colour but try to limit the number of different shades.
- Avoid the use of grid lines and 3-D effects.
- Figure legends explain symbols, line styles, etc., and are integral to understanding the figure and should use the same lettering that appear in the rest of the figure. Legends should be within or below the image and words in the legend should use title case.
Example:
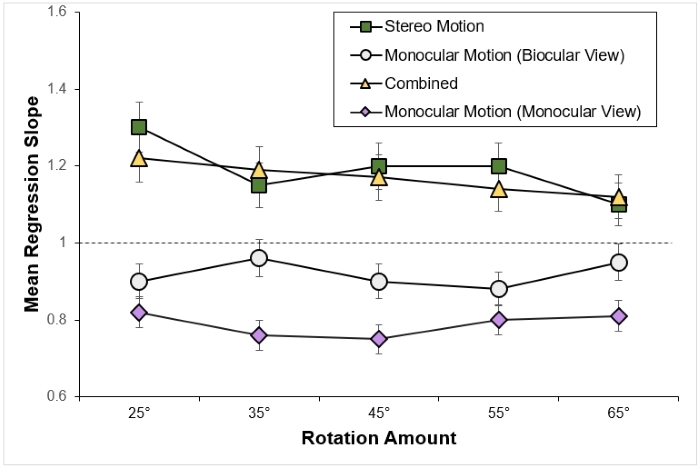
Figure 1
Mean Regression Slopes in Experiment 1

Note. Mean regression slopes in Experiment 1 are shown for the stereo motion, biocularly viewed monocular motion, combined, and monocularly viewed monocular motion conditions, plotted by rotation amount. Error bars represent standard errors. From “Large Continuous Perspective Change With Noncoplanar Points Enables Accurate Slant Perception,” by X. M. Wang, M. Lind, and G. P. Bingham, 2018, Journal of Experimental Psychology: Human Perception and Performance, 44(10), p. 1513 (https://doi.org/10.1037/xhp0000553). Copyright 2018 by the American Psychological Association.
(example from: https://apastyle.apa.org/style-grammar-guidelines/tables-figures/sample-figures#line)

